Ben Collins - Google Sheets Training Bundle
2 COURSE BUNDLE: Data Cleaning & Pivot Tables in Google Sheets + Build Dashboards with Google Sheets
Enhance your Google Sheets skills with this course bundle, covering the entire data workflow, from dealing with raw data through to creating beautiful reports.
This bundle includes:
- Data Cleaning and Pivot Tables in Google Sheets
- Build Dashboards with Google Sheets and Data Studio
The retail price for these two courses is $298 ($99 and $199 respectively), so this bundle represents outstanding value for your Google Sheets training needs.
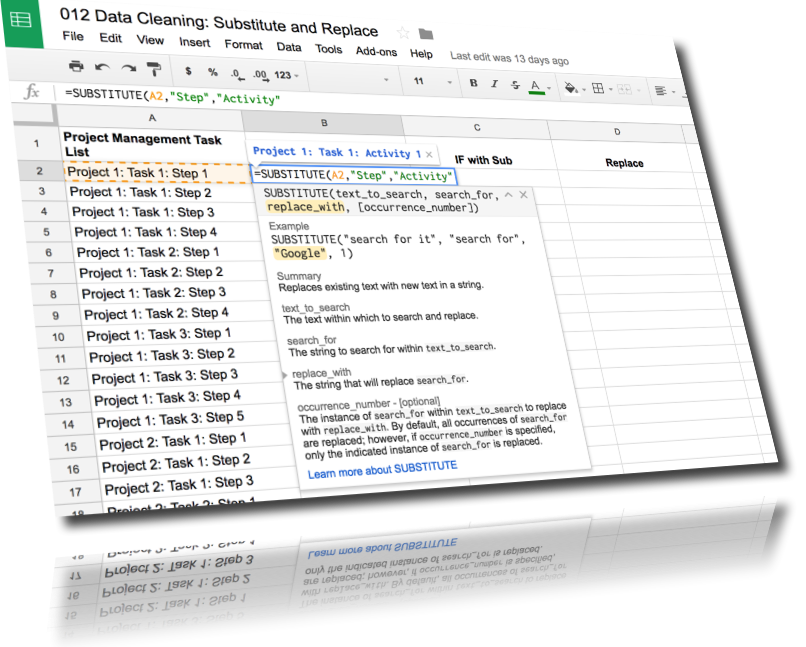
Course 1: Data Cleaning and Pivot Tables in Google Sheets
There's a joke in the data community that goes:
"You'll spend 90% of your time cleaning data, and the other 10% of your time complaining about cleaning your data."
Do you deal with badly formatted data that takes you hours to tidy up, preventing you from making progress on your "real" work?
Do you ever find yourself repeating a process manually, like extracting a zip code from an address?
Ever wondered what the heck a Pivot Table is, and why you should care about them?
This course is designed to help you work with messy, real-world datasets, and it's a fit for beginner-to-intermediate level Google Sheets users.
Through four hours of video tutorials, you'll learn techniques and best practices for cleaning data and preparing it for analysis and reporting -- saving you hours of tedious, repetitive work, and helping you get accurate results for your company.
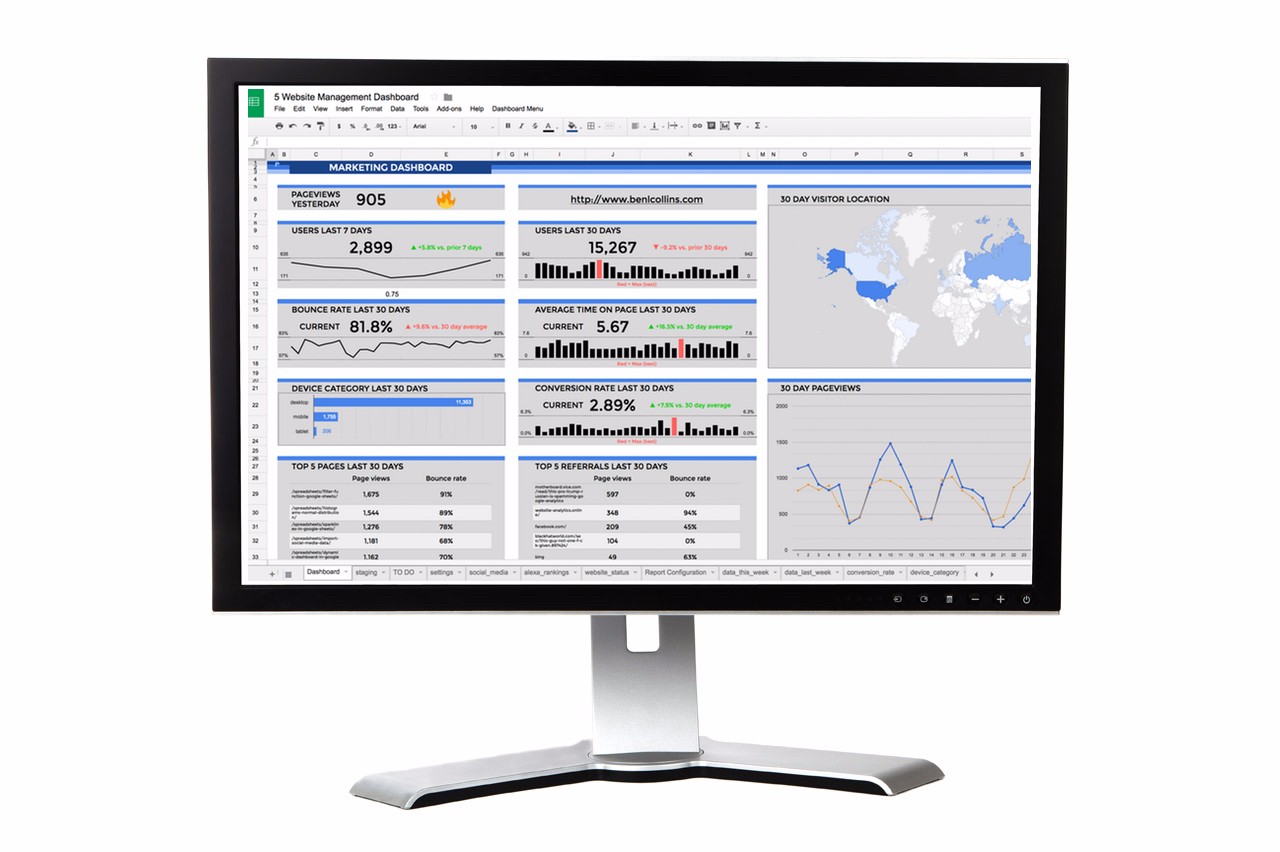
Course 2: Build Dashboards with Google Sheets and Data Studio
Do you spend hours collecting data, wrestling it into the format you need and then updating the same report that no one ever reads?
Or maybe you're neck deep in data but don't know how to use it to make sound business and marketing decisions?
Dashboards are fantastic tools that give you a high-level view of your business, showing KPIs, trends and data comparisons... so you can use that insight to grow your company in smart ways.
By learning some relatively simple techniques, you can create dashboards that are automated, interactive and visually appealing. They'll get people's attention and wow your colleagues and bosses.
This course covers everything you need to know about building beautiful business dashboards with Google Sheets and Google Data Studio.
What this course bundle will do for you:
This comprehensive course will teach all the key techniques for turning data cleaning, pivot tables and building beautiful, interactive dashboards in Google Sheet and Google's new dashboard tool, Data Studio. You'll be able to take messy, raw datasets and confidently turn them into insightful reports, so you can make key data-based decisions that were previously out of reach.
The core curriculum of both courses is built around practical examples and all the templates are included.
I'll be with you every step of the way, showing you the sheet setup, the formulas and the charts we use. For each example you'll have all the necessary raw data and formulas, as well as a final, finished template!
Your Instructor

Ben Collins
Who is teaching the course?
Ben Collins is an experienced data analytics instructor and freelance spreadsheet developer, helping businesses better understand their data through analytical insights and visualizations, including dashboards. He works primarily with Google Sheets, Apps Script and Data Studio, and also has extensive experience with Excel, SQL and Tableau. He previously taught data courses and workshops for General Assembly in Washington, D.C.
What you get with this course:
- 14 hours of video tutorials that walk you step-by-step through all the techniques.
- Access to all the raw data files, copies of the formulas and links to online documentation and other great resources.
- Copies of any finished dashboard templates for the five dashboard examples and the one Data Studio report. You'll be able to make your own copies for editing and reverse engineering as many times as you like.
- Membership to our dedicated Facebook group, where you can post questions and get answers, share insights and interact with other students.
- All the videos are online and you'll have 24/7 access for life.
Who is this course for?
- Anyone who works with data in Google Sheets.
- Someone who is curious to learn more about Google Sheets and dashboards.
- Maybe you're a data analyst, a technical marketer, an educator, a scientist or anything in between.
- Anyone who wants to add new skills, that will help you advance your career.
What are the prerequisites?
- A Google account.
- Access to Google Sheets.
- Basic familiarity with Google Sheets and spreadsheets, although the early parts of each course are set up so that everyone should be able to follow along.
- Access to Google Data Studio (for the last section of the dashboard course).
"Everyone talks about data culture in companies, but only a few know how to do it. Good dashboards are a great first step to democratize access to data in a simple way, and this course will definitely change the way you see your data today."
- Gabriel O.
"This course is a fantastic way to discover how to build dashboards. Ben takes you step by step through what you need to do and his approach is well thought out and organised. The information covers the basics and introduces more complex subjects in a simple and easy to follow format."
- Marilyn C.
"I’d recommend this course for anyone trying to make great dashboards in Google Sheets. Ben is a great teacher and he explains everything very thoroughly. Five stars from me."
- Jakob R.
"Before this course I had used a few simple formulas (okay Average and Sum only) but now I know how to use a vlookup as well as create Pivot Tables.
I’ve been making “Pivot Tables” wrong for years, entering all of the raw data myself. I am now able to make a Pivot Table that will update as needed. I like how Ben shows multiple ways to do data cleaning and why you would choose one method over the other. I enjoyed the case studies at the end because they brought the entire course together.
I will definitely be on the lookout for additional courses from Ben."
- Rachelle L.
"The course starts with a data cleaning section which is highly actionable and relevant to real world data sets that we all work with. My pivot table knowledge was pretty basic before this course and I am confident to say that I am now going to be able to implement them into my data analysis workflow.
This course also took my efficiency to the next level which is exactly what I needed as more of my time and analysis is starting to take place in sheets. I can't recommend this enough."
- John R.
"I am an academic librarian who has worked for years with massive raw data sets and pivot tables, and even gives related presentations at our regional conferences, and yet I learned from Ben's course several very useful tips and techniques that I didn't already know about and that will save me a lot of work.
I plan to recommend it to my colleagues as a very thorough course in getting data ready for the kind of data visualization contexts we need to provide to our decision-makers and stakeholders."
- Melissa B.
Frequently Asked Questions
When does the course start and finish?
The course starts now and never ends! It is a completely self-paced online course - you decide when you start and when you finish.
How long do I have access to the course?
How does lifetime access sound? After enrolling, you have unlimited access to this course for as long as you like - across any and all devices you own.
What if I am unhappy with the course?
We would never want you to be unhappy! If you are unsatisfied with your purchase, contact us in the first 30 days and we will give you a full refund.
Will I get copies of the finished dashboard templates?
Yes! All the raw data templates and the final, finished dashboard templates are provided, so you can download your own copies. The raw data file links are in the lectures titled RAW DATA and the final dashboard links are at the end of each chapter.
How is this course different from other online courses?
This course is data-focused and entirely practical. We start working with real data immediately and concepts are taught through practical examples.
Do you offer Parity Purchasing Power discounts?
Yes, I want my courses to be affordable to folks overseas in developing countries, who would otherwise not be able to purchase them. How does it work? Drop me a line with proof of where you're based and which course you're interested in, and I'll be glad to offer you a PPP discount on the course.
Can you provide an invoice for my company?
Yes, of course! After the purchase is complete, please forward me your receipt and the name/address you'd like to see on the invoice and I'll send one right back to you.
Why am I being charged VAT?
In order to comply with EU regulations, buyers in the EU will be charged VAT at checkout. This money is passed on to the relevant EU tax collection agency.